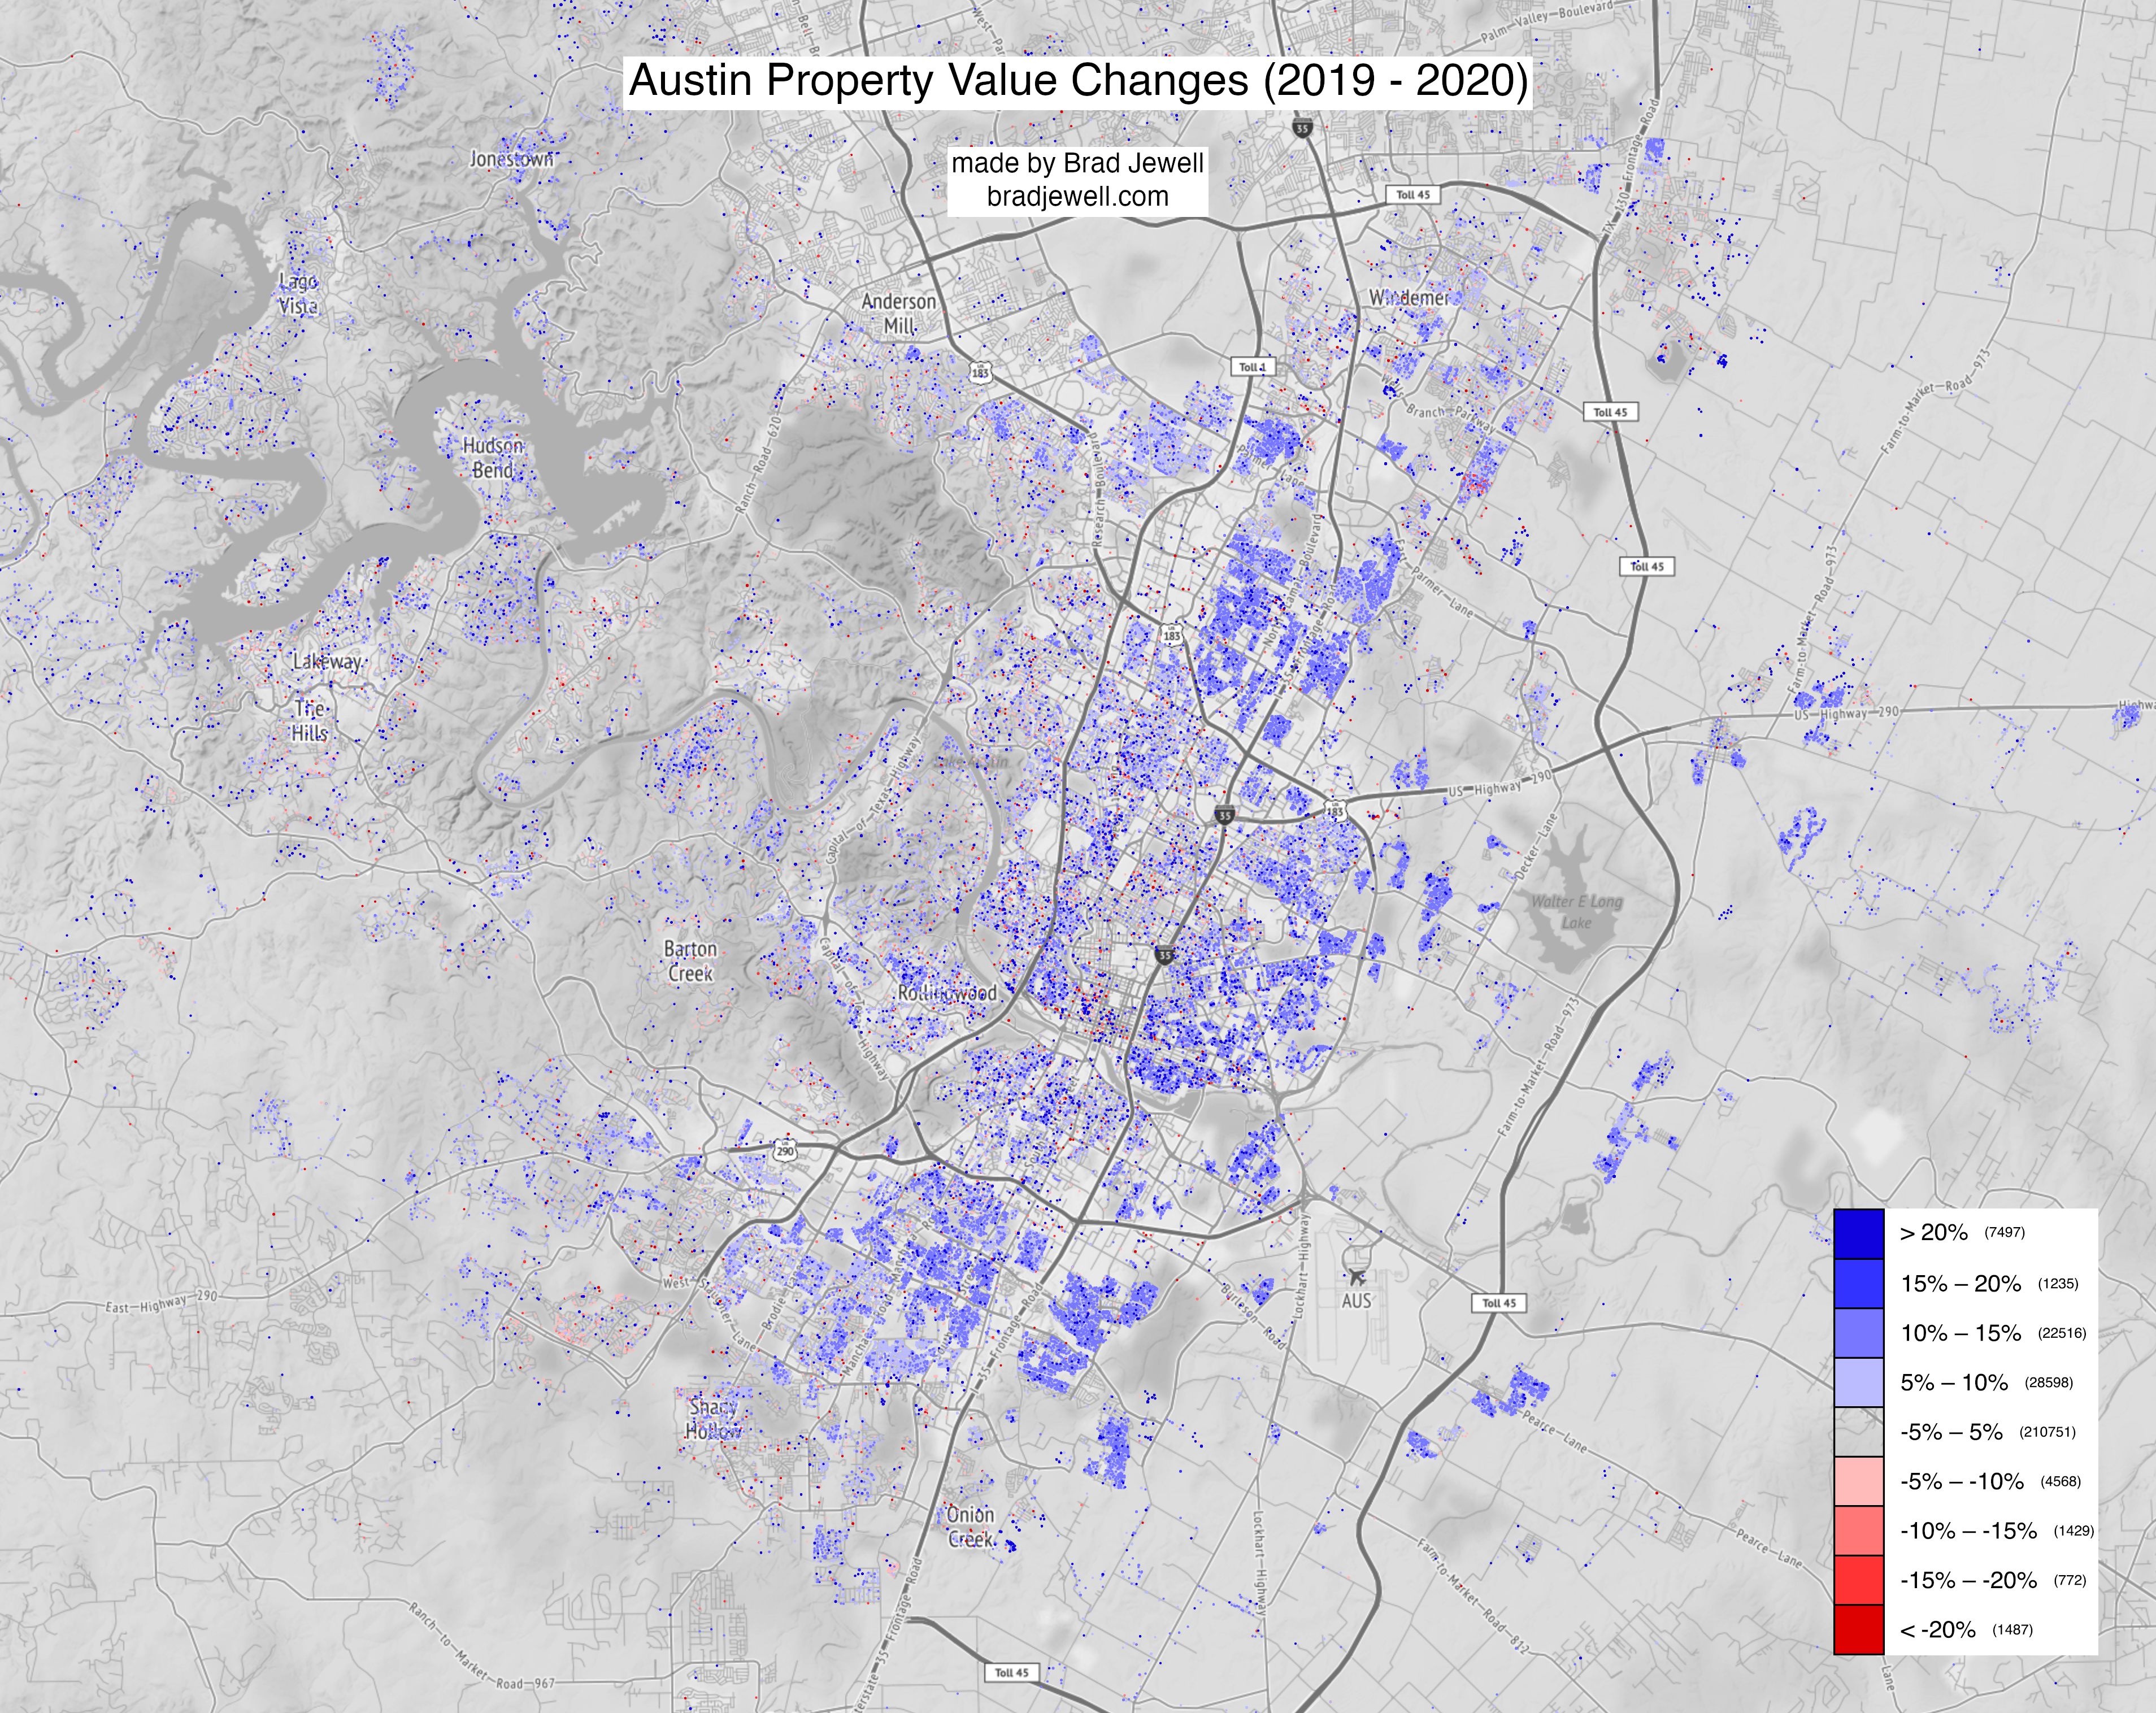
Austin Property Value Changes (2019-2020)
A visualization of the change in property values for Austin, TX from 2019 to 2020.
Click here to see the full size image.
First I went to TravisCAD's website and downloaded their "TCAD APPRAISAL ROLL EXPORT" from the publicly available data section.
They also provide a "APPRAISAL EXPORT LAYOUT" to help you parse the data (which had one small datatype error that was luckily easy to fix).
I then wrote a Python script to parse the data.
This gave me the 2020 market values of all the properties. To get the 2019 data, I went to archive.org and found a snapshot of the website from last year, which included a link to the 2019 dataset. Score!
I then downloaded a section of Texas surrounding Austin from OpenStreetMap (using an external mirror because the number of nodes was so large).
I loaded this map data into a local instance of Nominatim, which translates addresses into latitudes and longitudes.
I wrote a local webpage that uses OpenLayers to render the map, and draw colored dots on the map. I made the map grayscale as to not interfere with the visibility of the data.
I made the key in HTML because I got fed up with doing it in image editors, and I know HTML and CSS way better.
Then I used GIMP to composite the map, key, and title.